Research · Dataset v1.1
Refrigerant Leak Statistics 2026:
Rates, Costs & EPA Rules
This reference collects commercial refrigerant leak figures from identified public primary sources and preserves the population, method, year and limitation of each number. The goal is to make a figure harder to misuse by keeping it attached to its source context.[1]
- By
- KC Commercial Refrigeration
- Last verified
- Dataset version
- 1.1
- Records
- 45
No commercial content. This page contains no service-request routing, phone numbers, advertising or commercial recommendations. See editorial and source standards.
Table of contents
What are the headline statistics for commercial refrigerant leak rates?
The most widely cited figures for commercial refrigeration are 14.2% (GreenChill voluntary partner rate for 2023), approximately 21.2% (derived from EPA's modeled 2025 stock-to-leak ratio for systems over 15 pounds), 25% (EPA's historical food-retail estimate developed in 2007) and 35% (the upper end of the IPCC default range, used by EPA as a conservative screening factor for medium and large systems).[2][5][3][6][7] None of these figures is an observed national average drawn from a probability sample of every U.S. commercial refrigeration system.
Headline commercial refrigerant leak statistics summary
| Figure | Evidence class | Population | Period | Critical limitation |
|---|---|---|---|---|
| 14.2% | Reported program average | Voluntary GreenChill food-retail partners | 2023 | Voluntary program; not a national probability sample. |
| 13.8% | Reported program average | Voluntary GreenChill food-retail partners | 2007 | Voluntary program; not a national probability sample. |
| 15.6% | Regional assembled estimate | Massachusetts grocery chains (≥15 stores) | 2025 study | Includes 20% imputation; regional, not national. |
| ~21.2% | Derived model statistic | EPA model: Commercial Ref (>15 lb) | Modeled 2025 | Ratio from rounded model totals; not EPA's regulatory rate. |
| 25% | Historical industry estimate | U.S. food retail | Developed 2007 | Historical estimate; retained as comparison baseline only. |
| 10–35% | Modeled default range | Medium/large commercial (IPCC) | 2019 Refinement | Inventory default; not measured U.S. appliance performance. |
| 35% | Conservative screening factor | Medium/large commercial (EPA) | EPA guidance | Upper-end screening input. Not an observed average. |
Source: EPA GreenChill Annual Recognition 2024; DNV Massachusetts study Oct 2025; EPA RIA Addendum Sept 2024; EPA GreenChill (25% historical); IPCC 2019 Refinement Vol 3 Ch 7; EPA Direct Fugitive Emissions guidance.[2][4][5][3][7][6]
Do not average these figures. They come from different populations, methods and years. Averaging a program rate with a screening factor produces a number that belongs to no real population and has no source it can be traced to.
What do current commercial refrigerant leak statistics show?
This reference organizes every figure by evidence class because the same percentage can mean entirely different things depending on where it came from. A 14.2% program average, a 21.2% model-derived ratio and a 35% screening factor cannot be treated as three measurements of the same thing, even though they all appear in the range where people expect a commercial leak rate to land.
Evidence-class framework for commercial refrigerant leak figures
| Evidence class | What it is | Correct use | Key limitation |
|---|---|---|---|
| Reported program average | Voluntary-program figure reported by EPA | Describe as a program rate for participants | Voluntary; not a probability sample of all U.S. stores |
| Reported regional assembled estimate | Assembled from program data and market-actor values | Describe as a regional study result | Includes imputation; regional scope |
| EPA model input | Distributed value within EPA's Vintaging Model | Describe as modeled input | Model assumption; not a direct field measurement |
| Derived model statistic | Ratio calculated from EPA's rounded model totals | Describe as a model-derived aggregate ratio | Not EPA's published rate; derived from rounded totals |
| Derived model aggregate | Arithmetic sum of model rows | Describe as a combined row aggregate | Arithmetic combination of rounded totals |
| Derived model share / multiple | Proportion or multiple within model universe | Describe as a derived internal comparison | Based on rounded model totals |
| Historical industry estimate | Prior-decade agency estimate | Describe as a historical comparison baseline | Developed in 2007; not a current probability sample |
| Conservative screening factor | Upper-end default for first-pass estimation | Use only as a conservative screening input | Intentionally conservative; calling it an average overstates loss |
| Modeled default range | IPCC inventory default for national accounts | Use when no better national data are available | Not measured U.S. appliance performance |
| Federal legal trigger | Action threshold in current federal regulations | Describe as the legal threshold only | A trigger, not an acceptable operating target or industry average |
| Observed international comparator | Database observation from a different regulatory environment | Describe as a foreign comparator | Germany vs. U.S.: definitions, equipment, regulation all differ |
Source: KC Commercial Refrigeration evidence-class framework; individual entries trace to EPA, IPCC, eCFR and VDKF primary sources.
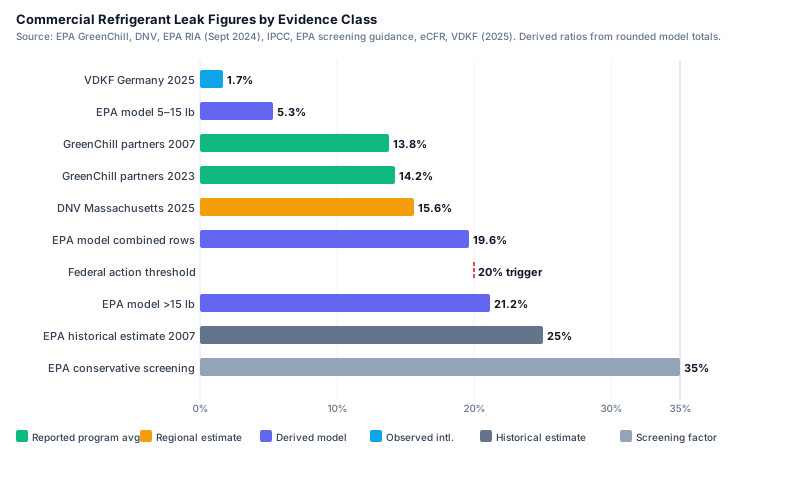
Complete source-normalized reference — 45 records
The table below lists all 45 records in this dataset. Each record preserves the population, method, geography, period and primary limitation of the figure it describes. Records are numbered RL-001 through RL-044, with RL-020 split into two sub-records (RL-020A and RL-020B) for the two federal chronic-leak thresholds.
Download the full structured dataset: refrigerant-leak-statistics.csv
| ID | Figure | Equipment scope | Evidence class | Geography · Period | Key limitation | Src |
|---|---|---|---|---|---|---|
| RL-001 | 1–15% | Stand-alone commercial refrigeration applications | Modeled default range | Global · 2019 Refinement | Not a measured U.S. industry average; operating-lifetime default. | [7] |
| RL-002 | 10–35% | Medium and large commercial refrigeration | Modeled default range | Global · 2019 Refinement | Not a measured U.S. industry average. Lower values associated with developed-country conditions. | [7] |
| RL-003 | 7–25% | Industrial refrigeration, including food processing and cold storage | Modeled default range | Global · 2019 Refinement | Not a measured U.S. industry average. | [7] |
| RL-004 | 15.0% | Stand-alone commercial applications | Conservative screening factor | United States · EPA guidance | Conservative estimation input. Do not describe as an observed average. | [6] |
| RL-005 | 35.0% | Medium and large commercial refrigeration | Conservative screening factor | United States · EPA guidance | Upper-end IPCC factor selected for conservative screening. Do not describe as an observed average. | [6] |
| RL-006 | 25.0% | Industrial refrigeration, including food processing and cold storage | Conservative screening factor | United States · EPA guidance | Conservative screening input. Do not describe as an observed average. | [6] |
| RL-007 | 25.0% | U.S. food retail commercial refrigeration | Historical industry estimate | United States · Developed 2007; retained as comparison line | Historical agency estimate. Not a current probability-sample census of all U.S. commercial refrigeration. | [2][3] |
| RL-008 | 13.8% | Voluntary GreenChill food-retail partners | Reported program average | United States · 2007 | Voluntary participants; not a probability sample of all U.S. stores. | [2] |
| RL-009 | 14.2% | Voluntary GreenChill food-retail partners | Reported program average | United States · 2023 | Voluntary participants; not a probability sample of all U.S. stores. | [2] |
| RL-010 | 411 lb/store | Voluntary GreenChill food-retail partners | Reported program average | United States · 2007 | Voluntary program data; averaging method and store mix can affect comparability. | [10] |
| RL-011 | 298 lb/store | Voluntary GreenChill food-retail partners | Reported program average | United States · 2023 | Voluntary program data; averaging method and store mix can affect comparability. | [10] |
| RL-012 | 2,862 lb/store | Voluntary GreenChill food-retail partners | Reported program average | United States · 2007 | Official statements do not fully reconcile on installed charge. No derived decline percentage published. | [2] |
| RL-013 | 2,033 lb/store | Voluntary GreenChill food-retail partners | Reported program average | United States · 2023 | Official statements do not fully reconcile on installed charge. No derived decline percentage published. | [2] |
| RL-014 | $899 million | GreenChill partners | Reported program estimate | United States · 2013–2023 (source wording) | Source wording is grammatically ambiguous; period measure is unclear. Preserve source wording or omit from headline copy. | [10] |
| RL-015 | $134 million | GreenChill partners | Reported program estimate | United States · 2023 | Replacement refrigerant only. Does not represent total leak-event cost. | [10] |
| RL-016 | More than $1,400/store/yr | GreenChill Certified Stores | Reported program estimate | United States · Program data through 2024 | Program comparison versus typical food-retail stores. Excludes other leak-related costs. | [11] |
| RL-017 | More than 2.54M MTCO2e | GreenChill Certified Stores | Reported program estimate | United States · 2008–2024 cumulative | Program estimate for certified stores. Not a national estimate. | [11] |
| RL-018 | 20% (≥50 lb ODS, Section 608) | Commercial refrigeration using a Class I or II ODS refrigerant or blend | Federal legal trigger (Section 608) | United States · Current 40 CFR §82.157 | Legal action threshold, not an operating target or acceptable average. State requirements can differ. | [9] |
| RL-019 | 20% (≥15 lb HFC, Part 84) | Commercial refrigeration with HFC or covered substitute, GWP > 53 | Federal legal trigger (Part 84) | United States · Effective 2026-01-01 | Legal action threshold, not an operating target or acceptable average. State requirements can differ. | [8] |
| RL-020A | 125% / calendar year (Section 608) | Covered Section 608 appliances ≥50 lb of Class I or II refrigerant | Federal reporting trigger (Section 608) | United States · Current 40 CFR §82.157 | Chronic-leak reporting threshold; report by March 1 of following year. Separate from the 20% repair threshold. | [9] |
| RL-020B | 125% / calendar year (Part 84) | Covered Part 84 appliances ≥15 lb of HFC or covered substitute | Federal reporting trigger (Part 84) | United States · Effective 2026-01-01 | Chronic-leak reporting threshold; report by March 1 of following year. Separate from the 20% repair threshold. | [8] |
| RL-021 | 1,500 lb charge threshold | Commercial refrigeration and industrial process refrigeration with covered HFCs | Federal equipment requirement | United States · New: 2026; certain existing: by 2027 | Minimum charge requiring automatic leak detection. Not a leak-rate statistic. | [13] |
| RL-022 | 1.7% | Commercial refrigeration category (Gewerbekälte) in VDKF-LEC database | Observed association-database average | Germany · 2025 VDKF-LEC data | International comparator only. Definitions, servicing practices, regulation, equipment mix and sampling differ from U.S. sources. Small systems underrepresented. Includes accidents or major accidental events. | [14] |
| RL-023 | 1.0% | All refrigeration and air-conditioning systems in VDKF-LEC database | Observed association-database average | Germany · 2025 VDKF-LEC data | International comparator. Overall database mix differs from U.S. commercial refrigeration. Small systems underrepresented. | [14] |
| RL-024 | ~307,000 systems | VDKF-LEC database overall coverage | Original-producer coverage statistic | Germany · 2025 | Commercial-refrigeration subset count not disclosed separately. Small systems underrepresented. | [14] |
| RL-025 | 7,600 MT stock; 400 MT leaks | EPA Table 3-3: Commercial Ref (5–15 lbs) | EPA model inputs | United States · Modeled 2025 | Modeled rounded values. Not a field census or appliance-level rate. | [5] |
| RL-026 | 69,000 MT stock; 14,600 MT leaks | EPA Table 3-3: Commercial Ref (>15 lbs) | EPA model inputs | United States · Modeled 2025 | Modeled rounded values. Not a field census or appliance-level rate. | [5] |
| RL-027 | 5.3% | EPA Table 3-3: Commercial Ref (5–15 lbs) | Derived model statistic | United States · Derived from modeled 2025 | Derived from rounded model totals. Not EPA's regulatory leak rate or a measured appliance average. | [5] |
| RL-028 | 21.2% | EPA Table 3-3: Commercial Ref (>15 lbs) | Derived model statistic | United States · Derived from modeled 2025 | Derived from rounded model totals. Not EPA's regulatory leak rate or a measured appliance average. | [5] |
| RL-029 | 76,600 MT stock; 15,000 MT leaks | Combined: EPA Table 3-3 two commercial rows | Derived model aggregate | United States · Derived from modeled 2025 | Arithmetic aggregation of rounded model totals. | [5] |
| RL-030 | 19.6% | Combined: EPA Table 3-3 two commercial rows | Derived model statistic | United States · Derived from modeled 2025 | Derived from rounded model totals. | [5] |
| RL-031 | 8% of RACHP stock; 20% of RACHP leaks | EPA Table 3-3: Commercial Ref (>15 lbs) | EPA model shares | United States · Modeled 2025 | Shares within the EPA table's defined RACHP universe. | [5] |
| RL-032 | 90.1% | Combined: EPA Table 3-3 two commercial rows | Derived model share | United States · Derived | Derived from rounded model totals: 69,000 ÷ 76,600 × 100. | [5] |
| RL-033 | 97.3% | Combined: EPA Table 3-3 two commercial rows | Derived model share | United States · Derived | Derived from rounded model totals: 14,600 ÷ 15,000 × 100. | [5] |
| RL-034 | 9.1× | Combined: EPA Table 3-3 two commercial rows | Derived model multiple | United States · Derived | Ratio of >15 lb stock to 5–15 lb stock from rounded model totals. | [5] |
| RL-035 | 36.5× | Combined: EPA Table 3-3 two commercial rows | Derived model multiple | United States · Derived | Ratio of >15 lb annual leak mass to 5–15 lb annual leak mass from rounded model totals. | [5] |
| RL-036 | 4.0× | Combined: EPA Table 3-3 two commercial rows | Derived model multiple | United States · Derived | Ratio of derived rate for >15 lb row to derived rate for 5–15 lb row: 21.159% ÷ 5.263%. | [5] |
| RL-037 | 15.6% | Massachusetts grocery chains operating 15 or more stores | Regional assembled estimate | United States (Massachusetts) · Study published 2025-10-30 | 13-brand, ~450-store universe. Includes 20% imputation where no interview or GreenChill rate was available. Raw market-actor values not released. | [4] |
| RL-038 | 16% | Massachusetts grocery chains operating 15 or more stores | Recommended regional program baseline | United States (Massachusetts) · Study published 2025-10-30 | Program baseline; not a measured U.S. national average or prediction for an individual store. | [4] |
| RL-039 | $16.04/lb | HFC-134a | Derived from EPA sampled public-buyer price | United States · EPA sample: 2024 through April 2026 | Public-buyer reference price; may exceed negotiated large-volume prices. Not a supplier quote. | [15] |
| RL-040 | $25.50/lb | R-404A | Derived from EPA sampled public-buyer price | United States · EPA sample: 2024 through April 2026 | Public-buyer reference price; may exceed negotiated large-volume prices. | [15] |
| RL-041 | $22.75/lb | R-410A | Derived from EPA sampled public-buyer price | United States · EPA sample: 2024 through April 2026 | Public-buyer reference price; may exceed negotiated large-volume prices. | [15] |
| RL-042 | $17.37/lb | R-448A | Derived from EPA sampled public-buyer price | United States · EPA sample: 2024 through April 2026 | Public-buyer reference price; may exceed negotiated large-volume prices. | [15] |
| RL-043 | $19.52/lb | R-449A | Derived from EPA sampled public-buyer price | United States · EPA sample: 2024 through April 2026 | Public-buyer reference price; may exceed negotiated large-volume prices. | [15] |
| RL-044 | $56.04/lb | HFO-1234yf | Derived from EPA sampled public-buyer price | United States · EPA sample: 2024 through April 2026 | Public-buyer reference price; may exceed negotiated large-volume prices. HFO-1234yf has very low GWP (~1). | [15] |
Source: See footnote numbers in the Src column. All figures traced to identified public primary sources; derived statistics labeled and distinguished from original-producer figures. Dataset version 1.1, last verified July 22, 2026.
Citation information
KC Commercial Refrigeration. (2026). Commercial Refrigerant Leak Statistics — Source-Normalized Dataset. Version 1.1. Last verified July 22, 2026. https://kccommercialrefrigeration.com/research/refrigerant-leak-statistics/. Available as CSV: refrigerant-leak-statistics.csv
What do these numbers show — and what do they not show?
The 14.2% GreenChill figure and the 21.2% EPA model ratio are not contradictory measurements of the same population. The gap between them reflects real differences in what each figure measures.
Why the GreenChill 14.2% rate and the EPA 21.2% model ratio differ
| Factor | GreenChill 14.2% (2023) | EPA model 21.2% (modeled 2025) |
|---|---|---|
| Population | Voluntary food-retail partners | All >15-lb RACHP systems in EPA's Vintaging Model |
| Measurement basis | Reported program rate | Ratio of modeled stock to modeled annual leak emissions |
| Data type | Observed program data | Model output from rounded totals |
| Year | 2023 (reported) | Modeled 2025 |
| Includes non-partners? | No | Yes (model covers the full sector) |
| Published as a rate by EPA? | Yes | No — this page derived the ratio from Table 3-3 |
Source: EPA GreenChill Annual Recognition 2024; EPA RIA Addendum September 2024, Table 3-3.[2][5]
GreenChill partner emissions declined — but the rate stayed roughly flat
| Year | Avg. pounds emitted per store | Reported partnership rate |
|---|---|---|
| 2007 | 411 lb | 13.8% |
| 2023 | 298 lb | 14.2% |
| Change | −113 lb (−27.5%) | +0.4 percentage points |
Source: EPA GreenChill Annual Recognition 2024; EPA GreenChill Partnership Accomplishments.[2][10]
Physical emissions fell because installed charge also declined — from approximately 2,862 lb/store to approximately 2,033 lb/store — while the percentage rate held roughly steady.[2]
What this reference can and cannot support
✔ Can support
- Stating the GreenChill 2023 partner rate as 14.2%, with its voluntary-program limitation
- Stating the EPA model-derived ratio for >15-lb commercial systems as approximately 21.2%, labeled as derived from rounded model totals
- Stating the IPCC default range for medium/large commercial as 10–35%, with its inventory-default limitation
- Stating the federal commercial-refrigeration threshold as an action trigger of 20% under both Section 608 and Part 84
- Stating the DNV Massachusetts assembled estimate as 15.6% for grocery chains operating ≥15 stores
- Converting any of the above rates to pounds, cost or CO2e using the formulas shown below
✘ Cannot support
- Publishing a single national average for all U.S. commercial refrigeration
- Describing 35% as the average or typical commercial leak rate
- Describing 20% as an acceptable operating standard
- Using the GreenChill program rate as a national census result
- Using the EPA model ratio as an appliance-level measured rate
- Substituting the Massachusetts regional estimate for a national benchmark
How was this refrigerant leak statistics dataset produced?
This dataset was produced by extracting figures from identified public primary sources, assigning each figure an evidence class, and recording the population, method, geography, period and key limitation that make the figure meaningful. No figures from secondary sources, industry estimates without a named origin, or anonymous expert opinion were included.[1]
Inclusion and exclusion rules
- Include: figures that trace to an identifiable public primary source and can be verified at that source.
- Include: derived statistics that are transparent arithmetic from primary-source inputs, clearly labeled as derived.
- Include: federal regulatory thresholds, definitions and formulas from the current eCFR.
- Exclude: secondary-source summaries, statistics attributed to unidentified experts or unnamed studies.
- Exclude: figures whose source cannot be located or verified at the original publisher.
- Exclude: statistics that claim a national U.S. average where no suitable national probability sample exists.
Normalization fields
Each record includes: record ID, metric group, figure, unit, equipment scope, evidence class, geography, period, source organization, source title, source URL, interpretation, key limitations and dataset version. The CSV download contains all fields.
Calculation rules
Derived statistics use these formulas, applied to primary-source inputs:
Stock-to-leak ratio
annual leak emissions (MT) ÷ installed stock (MT) × 100Replacement-only cost
pounds physically lost × price per poundDirect CO2e
leaked pounds × 100-year GWP ÷ 2,204.62262Annualizing method
[(lbs added ÷ full charge) ÷ (min(days since last addition, 365) ÷ 365)] × 100Rolling-average method
[applicable lbs added in the defined rolling period ÷ full charge] × 100Rounding rules
Derived percentages are shown to one decimal place. EPA's model totals are rounded in the source; derived statistics from those totals carry that rounding forward. GWP-based CO2e is rounded to one decimal place. Prices are rounded to two decimal places from EPA's published per-kilogram values.
Source-discrepancy log
Where official statements do not reconcile, this page records both without resolving them and withholds any derived statistic.
Unresolved discrepancies in official EPA statements
| Source | Statement A | Statement B | Handling |
|---|---|---|---|
| EPA GreenChill installed charge | 2,862 lb/store in 2007 and 2,033 lb/store in 2023 (recognition presentation) → visible difference of 829 lb | Accomplishments page states 2023 charge was 921 lb lower than 2007 | Both statements preserved. No derived decline percentage published. |
Source: EPA GreenChill Annual Recognition Event 2024; EPA GreenChill Partnership Accomplishments.[2][10]
Data files
- refrigerant-leak-statistics.csv — 45 source-normalized records with all normalization fields
- refrigerant-leak-impact-per-1000-lb.csv — 6-scenario per-1,000-pound impact matrix (pounds, R-404A tCO2e, R-448A tCO2e, R-744 tCO2e)
What is the average commercial refrigeration leak rate?
There is no defensible single current average across every commercial refrigeration system in the United States. The five source-specific figures most often cited — 14.2%, 15.6%, approximately 21.2%, 25% and 35% — reflect different populations, methods and purposes.[2][4][5][3][6]
GreenChill's 14.2% is the voluntary-partner rate. It covers a real population but not a random national sample: stores that participate in GreenChill are more likely to maintain equipment proactively.[2] DNV's 15.6% is a regional assembled estimate for one state and one store-size class, with disclosed imputation where market-actor data were unavailable.[4] The 21.2% ratio is derived arithmetic from EPA's rounded Vintaging Model totals — not a direct measurement and not EPA's own published rate.[5] The 25% figure is a historical estimate developed by EPA in 2007, retained as a comparison baseline, not updated with new sampling data.[3] And 35% is EPA's conservative screening input for medium and large systems, not an average.[6]
This page does not publish an average because doing so would combine numbers that belong to different populations, methods and years. Any number that results from that combination belongs to no real population and has no traceable source.
What does the 2025 Massachusetts grocery study show?
DNV's October 2025 study for the Massachusetts EEAC reports a 15.6% assembled estimate for grocery chains operating 15 or more stores in Massachusetts, and recommends 16% as a program baseline for the state's incentive program.[4]
DNV Massachusetts grocery refrigerant baseline study (2025)
| Item | Detail |
|---|---|
| Study universe | Grocery chains operating 15 or more stores in Massachusetts; approximately 13 brands, approximately 450 stores |
| Assembled estimate | 15.6% |
| Recommended program baseline | 16% (rounded) |
| Data sources used | Market-actor interviews, EPA GreenChill data, with 20% imputation where no interview or GreenChill rate was available |
| Disclosed imputation | 20% of the assembled estimate uses an imputed value where no market-actor interview or GreenChill rate was available |
| Raw data release | Raw market-actor values not publicly released |
| Study publication date | October 30, 2025 |
| Applicability limitation | Regional program baseline for a specific state incentive program; not a national average or individual-store prediction |
Source: DNV, Grocery Store Refrigerant Baseline Practices, October 30, 2025, prepared for Massachusetts EEAC.[4]
The methods section and conclusion description in the DNV study do not fully reconcile on the number of brands (five vs. six in different sections). That internal discrepancy does not change the assembled estimate or the recommended baseline, but it is recorded here because it affects how precisely the study universe can be characterized.
What are refrigerant leak rates by equipment type?
IPCC provides default ranges by equipment class for greenhouse-gas inventory work. These are not measured U.S. appliance rates. They are intended for national inventory estimates when better country-specific data are unavailable.[7]
IPCC 2019 Refinement default leak-rate ranges by equipment class
| Equipment class | IPCC default range (% per year) | Notes on use |
|---|---|---|
| Stand-alone commercial refrigeration applications | 1–15% | Lower values associated with developed-country conditions. Operating-lifetime default. |
| Medium and large commercial refrigeration | 10–35% | Upper end (35%) selected by EPA as conservative screening factor for this class. |
| Industrial refrigeration (food processing and cold storage) | 7–25% | Mid-point (25%) used by EPA as conservative screening factor for this class. |
Source: IPCC, 2019 Refinement to the 2006 IPCC Guidelines for National Greenhouse Gas Inventories, Volume 3, Chapter 7, Table 7.9.[7]
Why is 35% often quoted as the commercial refrigerant leak rate?
35% is not the average. It is the upper end of the IPCC default range for medium and large commercial refrigeration, and EPA adopted it as a conservative screening factor for that class.[6][7] It was never intended to describe typical performance.
How 35% became the most-quoted commercial refrigerant leak figure
| Step | What happened | Why it matters |
|---|---|---|
| 1. IPCC establishes a default range | IPCC 2019 Refinement Vol 3 Ch 7 Table 7.9 sets a 10–35% range for medium and large commercial refrigeration for national inventory use. | This range was designed for top-down national accounting, not individual-system benchmarking. |
| 2. EPA selects the upper end for conservative screening | EPA's Direct Fugitive Emissions guidance adopts 35% as the conservative screening factor for medium and large commercial systems. | A conservative factor intentionally overstates likely loss; using it as an average inflates estimates. |
| 3. 35% migrates into general usage without its label | Writers and web pages cite 35% as the average or typical leak rate, dropping the 'screening' and 'upper end' qualifiers. | Once the label is lost, the figure stops warning the reader that it was never meant to describe a typical system. |
Source: IPCC 2019 Refinement Volume 3 Chapter 7 Table 7.9; EPA Center for Corporate Climate Leadership Direct Fugitive Emissions guidance.[7][6]
What ratio is implied by EPA's modeled 2025 commercial-refrigeration stock and annual leak emissions?
EPA's September 2024 regulatory-impact analysis models 2025 installed stock and annual leak emissions. For the row labeled "Commercial Ref (>15 lbs)," it assigns 69,000 metric tons of installed HFC stock and 14,600 metric tons of annual leak emissions — a site-calculated aggregate derived modeled stock-to-annual-leak ratio of approximately 21.2%.[5]
EPA modeled 2025 stock and annual leak emissions by commercial-refrigeration row
| EPA Table 3-3 row | Modeled installed stock | Modeled annual leak emissions | Derived stock-to-annual-leak ratio | Share of RACHP stock | Share of RACHP annual leaks |
|---|---|---|---|---|---|
| Commercial Ref (5–15 lbs) | 7,600 MT | 400 MT | 5.3% | 1% | 1% |
| Commercial Ref (>15 lbs) | 69,000 MT | 14,600 MT | 21.2% | 8% | 20% |
| Combined two commercial rows | 76,600 MT | 15,000 MT | 19.6% | ~9% | ~21% |
Source: EPA, Regulatory Impact Analysis Addendum: Management of HFCs and Substitutes, September 2024, Table 3-3. Ratios and combined rows are calculations from EPA's rounded model values.[5]
Four original comparisons from EPA's table
Within the two rows labeled "Commercial Ref":
- The >15-pound category contains approximately 90.1% of modeled installed stock.
- It produces approximately 97.3% of modeled annual leak mass.
- Its installed stock is approximately 9.1 times the 5–15-pound category's.
- Its modeled annual leak mass is 36.5 times as large, and its derived ratio is approximately 4.0 times the smaller row's.
Derived comparisons from EPA Table 3-3 commercial-refrigeration rows
| Derived comparison | Calculation | Result |
|---|---|---|
| >15-lb share of two-row stock | 69,000 ÷ 76,600 | 90.1% |
| >15-lb share of two-row annual leak mass | 14,600 ÷ 15,000 | 97.3% |
| Installed-stock multiple | 69,000 ÷ 7,600 | 9.1× |
| Annual-leak-mass multiple | 14,600 ÷ 400 | 36.5× |
| Derived-ratio multiple | 21.159% ÷ 5.263% | 4.0× |
Source: Calculations by KC Commercial Refrigeration from EPA Table 3-3.[5]
What the 21.2% result is — and is not
14,600 MT ÷ 69,000 MT × 100 = 21.159%, or approximately 21.2%It is a transparent quotient from EPA's rounded model totals. It is not an EPA-published appliance leak rate, a direct field census, a legal threshold or proof that a particular system will lose 21.2% of charge. EPA's appendix explains that its model distributes equipment into leak-rate quintiles around average assumptions and, for some subsectors, adjusts values so at least one group exceeds the relevant repair threshold while preserving the weighted average.[5]
How much refrigerant does a supermarket leak per year?
EPA reports that an average GreenChill partner store emitted 298 pounds of refrigerant in 2023, down from 411 pounds in 2007. The 113-pound decline equals approximately 27.5%, but these are voluntary-program averages — not a prediction for every supermarket or every refrigeration system.[10]
GreenChill average refrigerant emitted per partner store
| Year | Avg. refrigerant emitted per partner store | Change from 2007 |
|---|---|---|
| 2007 | 411 lb | — |
| 2023 | 298 lb | −113 lb, or −27.5% |
Source: EPA GreenChill Partnership Accomplishments; change calculated as (411 − 298) ÷ 411.[10]
Pounds lost from a 1,000-pound full charge — six sourced or derived scenarios
| Scenario | Rate | Pounds lost |
|---|---|---|
| IPCC medium/large lower bound | 10.0% | 100.0 lb |
| GreenChill partner rate, 2023 | 14.2% | 142.0 lb |
| DNV Massachusetts assembled estimate | 15.6% | 156.0 lb |
| EPA Table 3-3 >15-lb derived ratio | 21.2% | 211.6 lb |
| EPA historical food-retail estimate | 25.0% | 250.0 lb |
| IPCC upper bound / EPA screening input | 35.0% | 350.0 lb |
Source: Rates from IPCC, EPA GreenChill, DNV, EPA RIA, EPA screening guidance; pounds calculated as 1,000 × rate.[7][2][4][5][3][6]
Full charge matters. A 10% physical loss equals 10 pounds on a 100-pound system, 100 pounds on a 1,000-pound system and 150 pounds on a 1,500-pound system.
Installed-charge discrepancy not turned into a statistic: EPA's recognition presentation shows 2,862 lb/store in 2007 and 2,033 lb/store in 2023, a visible difference of 829 lb. EPA's accomplishments page separately states that the 2023 figure was 921 lb lower than 2007. Because those official statements do not reconcile, this page does not publish a derived percentage decline in installed charge.[2][10]
How much do commercial refrigerant leaks cost?
Replacement-only cost equals the pounds physically lost multiplied by the relevant refrigerant price per pound. EPA's May 2026 economic memo supplies a dated public-buyer price layer through April 2026, and EPA separately estimates that GreenChill partners avoided $134 million in replacement-refrigerant purchases during 2023. Neither source measures the full cost of an individual leak event.[15][10]
Replacement-only cost formula
replacement-only cost = pounds physically lost × relevant price per poundThe price input is not universal. Refrigerant, package size, seller, purchase volume, contract terms, location and timing all matter.
EPA sampled refrigerant prices through April 2026
EPA's May 2026 economic memo reports sampled publicly available buyer prices for 2024 through April 2026. The per-pound column converts EPA's dollars-per-kilogram figures using 0.45359237 kg/lb. EPA warns that general-public prices may exceed negotiated large-volume prices.[15]
EPA sampled public-buyer refrigerant prices — 2024 through April 2026
| Refrigerant | EPA sampled avg. $/kg | Derived $/lb | Sample period | Publication guardrail |
|---|---|---|---|---|
| HFC-134a | $35.37 | $16.04 | 2024–April 2026 | Public-buyer reference, not a supplier quote. |
| R-404A | $56.21 | $25.50 | 2024–April 2026 | Public-buyer reference, not a supplier quote. |
| R-410A | $50.16 | $22.75 | 2024–April 2026 | Public-buyer reference, not a supplier quote. |
| R-448A | $38.29 | $17.37 | 2024–April 2026 | Public-buyer reference, not a supplier quote. |
| R-449A | $43.03 | $19.52 | 2024–April 2026 | Public-buyer reference, not a supplier quote. |
| HFO-1234yf | $123.55 | $56.04 | 2024–April 2026 | Public-buyer reference, not a supplier quote. |
Source: EPA, Analysis of Economic and Environmental Impacts, May 2026, Appendix D, Table D-1. Per-pound values are calculations from EPA's per-kilogram figures using 0.45359237 kg/lb.[15]
Replacement-only cost sensitivity — 1,000-pound full charge
| Scenario | Pounds lost | At $10/lb | At $20/lb | At $30/lb | At $50/lb |
|---|---|---|---|---|---|
| GreenChill 14.2% | 142.0 | $1,420 | $2,840 | $4,260 | $7,100 |
| EPA model-derived 21.2% | 211.6 | $2,116 | $4,232 | $6,348 | $10,580 |
| EPA historical 25% | 250.0 | $2,500 | $5,000 | $7,500 | $12,500 |
Source: Sourced rates from EPA material; calculations by KC Commercial Refrigeration. Price columns are sensitivity inputs, not market-price estimates.[2][5][3]
Official GreenChill program cost outcomes
| EPA program metric | Reported amount | Scope limitation |
|---|---|---|
| Estimated replacement-refrigerant purchases avoided by GreenChill partners | $134 million in 2023 | Program-level estimate; replacement refrigerant only. |
| Average replacement-refrigerant savings at GreenChill Certified Stores | More than $1,400/store/yr | Comparison with typical food-retail stores; not total repair cost. |
Source: EPA GreenChill Partnership Accomplishments; EPA GreenChill Certified Store Achievements.[10][11]
A full leak event can also involve diagnostics, technician labor, parts, verification testing, emergency service, energy inefficiency, product loss, downtime and administrative work. No authoritative U.S. national primary dataset supports one all-in average that can be applied honestly to every commercial system.
How much climate impact does a refrigerant leak create?
Direct climate impact depends on the leaked mass and the refrigerant's 100-year global warming potential (GWP). At a 14.2% illustrative loss from a 1,000-pound charge, 142 leaked pounds equal approximately 252.6 metric tons CO2e for R-404A, 89.3 for R-448A and 0.064 for R-744 using EPA's listed GWP values.[16]
Direct CO2e formula
metric tons CO2e = leaked pounds × 100-year GWP ÷ 2,204.62262This covers direct refrigerant emissions. It does not include electricity-related emissions, equipment manufacturing or other lifecycle effects.
Direct CO2e per 100 pounds leaked — selected refrigerants
| Refrigerant | EPA 100-year GWP | Metric tons CO2e per 100 lb leaked |
|---|---|---|
| R-507A | 3,985 | 180.8 |
| R-404A | 3,922 | 177.9 |
| HFC-134a | 1,430 | 64.9 |
| R-449A | 1,396 | 63.3 |
| R-448A | 1,386 | 62.9 |
| R-513A | 630 | 28.6 |
| R-290 (propane) | 3.3 | 0.150 |
| R-717 (ammonia) | 1 | 0.045 |
| R-744 (CO₂) | 1 | 0.045 |
Source: EPA Technology Transitions GWP Reference Table; CO2e values calculated from 100 leaked pounds.[16]
Equal leaked masses do not mean the listed refrigerants are interchangeable. The table isolates one variable: the direct GWP-based effect of an emitted mass.
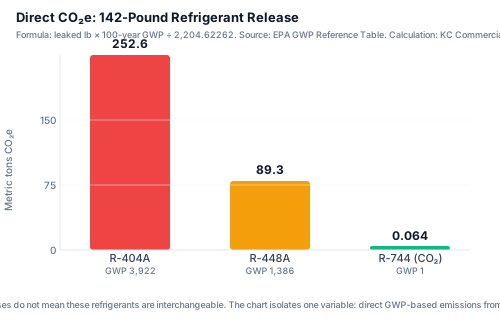
Direct CO2e from a 142-pound refrigerant release
| Refrigerant | Leaked mass | EPA GWP | Direct emissions |
|---|---|---|---|
| R-404A | 142 lb | 3,922 | 252.6 metric tons CO2e |
| R-448A | 142 lb | 1,386 | 89.3 metric tons CO2e |
| R-744 (CO₂) | 142 lb | 1 | 0.064 metric tons CO2e |
Source: EPA GWP values; calculations by KC Commercial Refrigeration using the formula above.[16]
Per-1,000-pound impact matrix — six sourced scenarios
| Evidence scenario | Rate | Pounds leaked | R-404A tCO2e | R-448A tCO2e | R-744 tCO2e |
|---|---|---|---|---|---|
| IPCC medium/large lower bound | 10.0% | 100.0 | 177.9 | 62.9 | 0.045 |
| GreenChill partner figure, 2023 | 14.2% | 142.0 | 252.6 | 89.3 | 0.064 |
| Federal commercial threshold (physical-loss illustration only) | 20.0% | 200.0 | 355.8 | 125.7 | 0.091 |
| EPA Table 3-3 derived ratio for Comm. Ref (>15 lbs), modeled 2025 | 21.2% | 211.6 | 376.4 | 133.0 | 0.096 |
| EPA historical food-retail estimate | 25.0% | 250.0 | 444.7 | 157.2 | 0.113 |
| IPCC upper bound / EPA screening factor | 35.0% | 350.0 | 622.6 | 220.0 | 0.159 |
Source: Rates from IPCC, EPA GreenChill, EPA RIA, federal rules and EPA screening guidance; GWP values from EPA; all outputs calculated from the displayed formulas.[7][2][5][8][6][16]
Interpretation warning: The rows have different evidentiary meanings. The 20% row shows the physical impact of a 20% loss on a common charge, while EPA's regulatory 20% leak rate is calculated through prescribed annualizing or rolling-average methods and is not necessarily equal to calendar-year physical loss divided by installed charge.
EPA also reports that GreenChill Certified Stores avoided more than 2.54 million metric tons CO2e from 2008 through 2024 through preventive maintenance and leak reduction. That is a program estimate for certified stores, not a national estimate for all commercial refrigeration.[11]
What EPA commercial-refrigeration leak thresholds apply in 2026?
Covered commercial-refrigeration appliances are subject to a 20% federal action threshold under both Clean Air Act Section 608 and the AIM Act management rules, but the regimes cover different appliances. Section 608 generally applies at 50 pounds or more of a Class I or Class II ozone-depleting refrigerant or a blend containing one; Part 84 generally applies at 15 pounds or more of an HFC or covered substitute with GWP greater than 53, subject to the rule's details and exceptions.[9][8]
The 20% figure is an action threshold — not an operating target, an acceptable average, or permission to leak up to 20%.
Section 608 and Part 84 crosswalk — key provisions
| Requirement | Section 608: 40 CFR §82.157 | Part 84: 40 CFR §84.106 |
|---|---|---|
| Main refrigerant scope | Class I or Class II ODS refrigerant, or a blend containing one; substitute-only appliances are excluded. | HFC or a substitute for an HFC with GWP greater than 53, subject to stated exclusions. |
| Minimum full charge for leak-repair provisions | 50 lb | 15 lb |
| Commercial-refrigeration action threshold | Exceeds 20% | Exceeds 20% |
| Industrial-process refrigeration threshold | Exceeds 30% | Exceeds 30% |
| Comfort-cooling / other applicable threshold | Exceeds 10% | Exceeds 10% for the categories identified in the rule |
| Standard repair period | 30 days; 120 days when an industrial-process shutdown is required, subject to rule provisions | 30 days; 120 days when an industrial-process shutdown is required, subject to rule provisions |
| Inspection cadence below 500 lb | After an exceedance, annual until the stopping condition is met | After a successful follow-up verification test, annual until the stopping condition is met |
| Inspection cadence at 500 lb or more | After an exceedance, quarterly until four consecutive quarters satisfy the stopping condition | After a successful follow-up verification test, quarterly until four consecutive quarters satisfy the stopping condition |
| Chronic-leak reporting | 125% or more of full charge in a calendar year; report by March 1 of the following year | 125% or more of full charge in a calendar year; report by March 1 of the following year |
| Effective context | Existing Section 608 ODS regime | Requirements apply beginning January 1, 2026 |
Source: Current 40 CFR §§82.157 and 84.106, last verified July 22, 2026.[9][8]
What counts as commercial refrigeration?
Part 84 defines commercial refrigeration as refrigerant-containing appliances used in retail-food and cold-storage-warehouse subsectors. Examples include systems used in supermarkets, convenience stores, restaurants, other food-service establishments and facilities storing meat, produce, dairy products and other perishable goods.[12]
What happens after a covered appliance exceeds 20%?
The applicable rule may require repair or a retrofit/retirement path, followed by verification, inspections, records and reporting. For covered Part 84 commercial systems:
- After a successful follow-up verification test, systems from 15 pounds to under 500 pounds generally require annual leak inspections until the rule's stopping condition is met.
- After a successful follow-up verification test, systems with 500 pounds or more generally require quarterly inspections until four consecutive quarters satisfy the stopping condition.
- A qualifying automatic leak-detection system can affect periodic-inspection requirements when regulatory conditions are met.[8][13]
When is automatic refrigerant leak detection required?
Part 84 requires automatic leak detection for covered commercial-refrigeration and industrial-process-refrigeration appliances with a full charge of at least 1,500 pounds.[13]
Automatic leak-detection compliance timing under 40 CFR §84.108
| System installation date | Automatic leak-detection timing |
|---|---|
| Installed on or after January 1, 2026 | At installation or within 30 days, as specified by the rule. |
| Installed from January 1, 2017 through December 31, 2025 | By January 1, 2027, when covered. |
Source: 40 CFR §84.108.[13]
Direct systems must detect 10 parts per million and alert at 100 parts per million. Indirect systems must alert at a measured loss of 50 pounds or 10% of full charge, whichever is less. The system must be audited and calibrated annually.[13]
Federal-reference limitation: This section is educational, not legal advice. Applicability depends on refrigerant, full charge, equipment classification, installation date, exclusions, extensions and potentially stricter state requirements. The controlling regulation and applicable state law govern a specific appliance; the eCFR is an authoritative but unofficial online compilation.
How does EPA calculate a refrigerant leak rate?
EPA defines leak rate as the percentage of an appliance's full charge that would be lost over 12 months if the current rate of loss continued. Part 84 provides an annualizing method and a rolling-average method, and requires an operating facility to use the same selected method for all appliances subject to the leak-repair requirements.[12]
This regulatory rate is not automatically equal to calendar-year leak mass divided by installed stock. That is why the 20% legal threshold cannot be substituted for the 21.2% derived model ratio — or vice versa.
Full charge
"Full charge" is the amount of refrigerant required for normal operation. The rule allows manufacturer information, engineering calculations, actual measurements or an established operating range whose midpoint is used, alone or in combination.[12]
Annualizing method
[(pounds added ÷ full charge) ÷ (min(days since the last refrigerant addition, 365) ÷ 365)] × 100Example: A 300-pound appliance receiving 20 pounds after 90 days:
(20 ÷ 300) ÷ (90 ÷ 365) × 100 = 27.0%Rolling-average method
[applicable pounds added during the defined rolling period ÷ full charge] × 100Example: A 300-pound appliance with 60 applicable pounds added during the preceding 365 days:
60 ÷ 300 × 100 = 20.0%What changes for the first Part 84 calculation after January 1, 2026?
For the first Part 84 calculation after January 1, 2026, the annualizing method substitutes 365 days as the days-since-last-addition value, while the rolling-average method uses refrigerant additions made since January 1, 2026. This transition instruction prevents pre-applicability periods and additions from being handled as though Part 84 had already operated for a full year.[8]
Common calculation errors
| Error | Why it changes the result |
|---|---|
| Reversing the annualizing and rolling-average labels | The methods use different periods and can produce different percentages. |
| Using an incomplete nameplate charge | Field piping or added components can change full charge. |
| Mixing methods within one operating facility | Part 84 requires the same selected method for covered appliances at the facility. |
| Counting excluded additions | The rules specify which additions enter the calculation. |
| Treating a benchmark as the federal calculation | A portfolio or model rate is not automatically an appliance-level regulatory rate. |
| Comparing against the wrong category or rule | Threshold and applicability depend on equipment and refrigerant scope. |
Source: 40 CFR §§84.102 and 84.106; examples calculated by KC Commercial Refrigeration.[12][8]
How do U.S. figures compare with observed international data?
VDKF reported a 1.7% average for the commercial-refrigeration category in its German 2025 database analysis. It is a useful recent observed comparator, but it cannot be substituted for a U.S. national average because geography, equipment mix, regulation, sampling and event definitions differ.[14]
VDKF 2025 database analysis — reported details
| VDKF item | Reported detail |
|---|---|
| Overall database rate | 1.0% in 2025 |
| Commercial-refrigeration category | 1.7% in 2025 |
| Overall database coverage | Nearly 67,000 operators and approximately 307,000 refrigeration and air-conditioning systems |
| Commercial-category sample count | Not disclosed separately |
| Small-system representation | Underrepresented because the database mainly captures systems subject to mandatory periodic leak checks |
| Included events | VDKF states that the calculation includes accidents or major accidental events (Havarien) |
Source: VDKF, Kältemittel-Leckagerate liegt bei nur noch 1,0 %, reporting 2025 VDKF-LEC data.[14]
Why the international comparison remains separate from U.S. figures
| Comparability factor | GreenChill (U.S.) | VDKF (Germany) |
|---|---|---|
| Geography | United States | Germany |
| Population | Voluntary food-retail partners | Systems represented in an association database |
| Commercial-category count | Partner/store counts disclosed at program level | Not disclosed separately |
| Small systems | Program scope differs from an all-equipment census | Explicitly underrepresented |
| Included events | GreenChill corporate reporting methodology | VDKF explicitly includes accidents or major accidental events |
| Legal and service environment | U.S. program and regulatory context | German/EU context |
Source: EPA GreenChill and VDKF original-producer material.[2][14]
The point of the comparison is not to rank countries. It is to show how far an observed result can move when the population, maintenance regime and reporting system change.
Why do refrigerant leak statistics matter in 2026?
January 1, 2026 marked the applicability date for Part 84 leak-repair requirements covering qualifying HFC and substitute-refrigerant appliances with at least 15 pounds. That makes old summaries risky: a page can repeat the correct 20% commercial threshold while attaching it to the wrong refrigerant scope, charge threshold, calculation method, inspection timing or reporting rule.[8]
The 15-pound Part 84 scope did not erase Section 608's separate 50-pound ODS regime. The two rules now sit beside each other, and a technically correct percentage can still be legally misleading when its scope is wrong.
For the first Part 84 calculation after January 1, 2026, annualizing-method users substitute 365 days for the elapsed-days value, while rolling-average users count applicable additions made since January 1, 2026. That date-specific instruction is easy to miss in a generic threshold summary.[8]
What are the limitations of this refrigerant leak dataset?
This dataset improves comparability by preserving definitions and source context, but it cannot create a national observed average where no suitable national probability sample exists.
- GreenChill is a voluntary program
- GreenChill covers a substantial food-retail participant group, but participation does not turn the dataset into a random national sample. Its 14.2% figure must remain a partnership rate.[2]
- EPA's modeled ratios are not appliance measurements
- The 21.2% result is derived from rounded model totals. It is not a direct appliance survey or the federal leak-rate calculation.[5]
- The Massachusetts estimate includes imputation
- DNV's 15.6% result covers a regional 15+ store segment and uses a 20% imputation where no interview or GreenChill rate was available. Raw market-actor values were not released.[4]
- IPCC values are inventory defaults
- They are intended for greenhouse-gas inventory work when better information is unavailable. They are not measured U.S. appliance performance.[7]
- EPA screening factors are intentionally conservative
- The 35% figure is useful for its screening purpose. Calling it an average changes the source's meaning.[6]
- Regulatory rates have their own definition
- The federal rate projects loss over 12 months using the annualizing or rolling-average method. It cannot be assumed to equal calendar-year physical loss divided by installed charge.[12]
- Cost coverage is incomplete
- EPA's sampled prices are public-buyer references, not negotiated facility prices or repair invoices. The page supports replacement-only calculations and scoped program estimates, not a universal all-in event cost.[15]
- Official EPA statements do not fully reconcile on installed charge
- The 829-pound visible endpoint difference and the separate 921-pound statement remain in the source notes. No derived decline percentage is published.[2][10]
- GWP values depend on the selected reference basis
- The CO2e tables use EPA's current Technology Transitions reference values as verified on July 22, 2026. A different accepted GWP basis can produce a different result.[16]
- International data are not directly interchangeable
- VDKF's German result comes from a different regulatory and sampling environment and includes accidents or major accidental events. It remains an international comparator, not a substitute U.S. benchmark.[14]
- Data year and verification date are different
- "Last verified July 22, 2026" means the sources and calculations were rechecked on that date. It does not mean every underlying measurement was made in 2026.
Who produced this reference, and why?
KC Commercial Refrigeration produced and publishes this source-normalized reference. The site is a commercial-refrigeration service-request website, not a contractor, regulator, laboratory, university or trade association; the research page is based on public primary sources and contains no service-request routing or commercial recommendation.[1]
By KC Commercial Refrigeration
No named engineer, regulator, reviewer or subject-matter expert is attributed because no such person reviewed the page under a documented process.
How it was produced
- Primary-source extraction from EPA, eCFR, IPCC, DNV and VDKF material.
- Current-regulation verification on July 22, 2026.
- A 45-record source-normalized public dataset.
- A six-scenario public impact matrix.
- Arithmetic checks for percentages, pounds, prices, costs and CO2e.
- An internal claim ledger distinguishing publishable, qualified, withheld and rejected claims.
- A public source-discrepancy log for official statements that do not reconcile.
Why it exists
The page exists to make commercial refrigerant leak percentages harder to misuse. A reader should be able to identify the right figure for a specific question without losing its population, method, year or limitation.
Frequently asked questions about refrigerant leak statistics
The answers below preserve the scope and evidence class of each number.
- What is the average commercial refrigeration leak rate?
- There is no defensible universal current average across every commercial-refrigeration system. Source-specific figures include a 14.2% GreenChill partner rate for 2023, a 15.6% DNV Massachusetts assembled estimate, an approximately 21.2% ratio derived from EPA's modeled >15-pound category, a historical EPA estimate of 25% and IPCC default ranges that vary by equipment class.[2][4][5][3][7]
- Is 35% the average refrigerant leak rate?
- No. Thirty-five percent is the upper end of the IPCC default range for medium and large commercial refrigeration and the conservative factor EPA uses for that class in its screening method. It is not a measured universal average.[7][6]
- What is EPA's commercial-refrigeration leak threshold?
- The federal commercial-refrigeration action threshold is a calculated rate that exceeds 20% for covered appliances under both Section 608 and Part 84. Their refrigerant scope and minimum full charge differ: Section 608 generally starts at 50 pounds for covered ODS appliances, while Part 84 generally starts at 15 pounds for covered HFC or substitute appliances, subject to the rules' details and exceptions.[9][8]
- Is a 20% refrigerant leak rate acceptable?
- Twenty percent should not be described as an acceptable operating target or industry average. It is a legal action threshold for defined covered equipment; a lower rate is not automatically leak-free, efficient or sufficient under every federal or state requirement.[9][8]
- What is the 125% chronic-leak reporting threshold?
- Covered Section 608 appliances with at least 50 pounds and covered Part 84 appliances with at least 15 pounds must be reported to EPA by March 1 of the following year when calendar-year leakage reaches at least 125% of full charge. Repeated leakage and recharging can produce cumulative losses above 100%.[9][8]
- How many pounds of refrigerant does a supermarket leak per year?
- EPA reports that an average GreenChill partner store emitted 298 pounds in 2023, compared with 411 pounds in 2007. These are voluntary-program averages, not a national prediction for every supermarket; for an illustrative calculation, multiply full charge by the selected physical-loss fraction.[10]
- How much does a commercial refrigerant leak cost?
- Replacement-only cost equals the pounds physically lost multiplied by the relevant price per pound. EPA's May 2026 memo supplies dated public-buyer reference prices through April 2026, while total event costs can also include diagnostics, labor, parts, energy, downtime, spoilage and administrative work.[15]
- How do you convert leaked refrigerant to CO2e?
- Multiply leaked pounds by the refrigerant's 100-year GWP and divide by 2,204.62262. Using EPA's GWP of 3,922 for R-404A, a 100-pound release equals approximately 177.9 metric tons CO2e.[16]
- How does EPA calculate the refrigerant leak rate?
- EPA provides an annualizing method and a rolling-average method. The annualizing method adjusts a refrigerant addition for elapsed time; the rolling-average method uses applicable additions over the preceding 365 days or the shorter defined period since a successful follow-up verification test.[12]
- When is automatic refrigerant leak detection required?
- Part 84 requires automatic leak detection for covered commercial-refrigeration and industrial-process-refrigeration appliances with at least 1,500 pounds of full charge. Installation timing depends on the appliance's installation date.[13]
- Does Section 608 apply to HFC-only appliances?
- The leak-repair provision in 40 CFR §82.157 applies to appliances with at least 50 pounds of a Class I or Class II ozone-depleting refrigerant or a blend containing one, and excludes appliances containing solely substitute refrigerants. Covered HFC and substitute appliances are addressed through the separate Part 84 regime.[9][8]
Where do the data come from, and how will they be updated?
Every consequential figure traces to an issuing agency, current regulation, inventory-methodology body or original data producer. The stable dataset follows a planned maintenance schedule: source years remain attached to records, substantive changes create a new version and prior files remain archived instead of being silently overwritten.
Primary-source map
| Issuer | Primary source | Used for |
|---|---|---|
| U.S. EPA | September 2024 ER&R Regulatory Impact Analysis Addendum | Modeled 2025 installed stock, annual leak emissions and Vintaging Model limitations. |
| U.S. EPA GreenChill | 2024 Annual Recognition Event and 2022 fifteen-year report | 13.8%, 14.2%, origin and continued display of the 25% estimate, partner context and installed-charge endpoints. |
| U.S. EPA GreenChill | Partnership Accomplishments | 411 lb, 298 lb, $134 million and the unresolved installed-charge statement. |
| U.S. EPA GreenChill | Certified Store Achievements | More than $1,400 per store and more than 2.54 million MTCO2e avoided. |
| DNV / Massachusetts EEAC | Grocery Store Refrigerant Baseline Practices (Oct 2025) | 15.6% regional assembled estimate, 16% recommended baseline, study universe, imputation and limitations. |
| IPCC | 2019 Refinement, Volume 3, Chapter 7, Table 7.9 | 1–15%, 10–35% and 7–25% default ranges. |
| U.S. EPA Center for Corporate Climate Leadership | Direct Fugitive Emissions guidance | 15%, 35% and 25% conservative screening factors and screening-method limitations. |
| eCFR | 40 CFR §§82.157, 84.102, 84.106 and 84.108 | Federal scope, definitions, formulas, thresholds, inspections, reporting and automatic detection. |
| U.S. EPA | Technology Transitions GWP Reference Table | GWP values used in direct CO2e calculations. |
| U.S. EPA | May 2026 economic and environmental impacts memo | Sampled public-buyer refrigerant prices through April 2026. |
| VDKF | 2025 VDKF-LEC database analysis | German 1.7% comparator, overall database coverage, included incidents and sampling limitations. |
Source: The issuing documents listed in the footnotes.[5][2][3][10][11][4][7][6][9][12][8][13][16][15][14]
Planned maintenance schedule
| Element | Review cadence | Verification method |
|---|---|---|
| Part 84 rules | Monthly source check; quarterly full review; immediate after a rule change | Recheck 40 CFR §§84.102, 84.106 and 84.108. |
| Section 608 rules | Quarterly and after rule changes | Recheck 40 CFR §82.157. |
| GreenChill partnership rate and participation | Quarterly; focused review after annual recognition material | Check recognition presentations and current program pages. |
| GreenChill pounds and cost outcomes | Quarterly | Reconcile Partnership Accomplishments and Certified Store Achievements. |
| EPA regulatory model | Annually and after a new RIA or Vintaging Model release | Recheck modeled stock, annual leak emissions and methodology. |
| DNV Massachusetts comparator | Annually or after a revised program study | Recheck the original memo and any replacement baseline. |
| EPA sampled prices | Quarterly while the reference remains current | Recheck the economic memo or a superseding official table. |
| IPCC default factors | Annually or after revised inventory guidance | Recheck the current IPCC methodology. |
| EPA GWP values | Quarterly and after Part 84 amendments | Recheck EPA's current reference table. |
| VDKF comparator | Annually | Recheck the original VDKF-LEC publication and disclosed coverage. |
| Calculator and derived tables | After every source, formula or GWP change | Recompute from stored inputs and run known-value tests. |
Source: KC Commercial Refrigeration planned maintenance schedule, dataset version 1.1.
Version history
| Version | Verification date | Change |
|---|---|---|
| 1.1 | Initial public release: 45 source-normalized records and six impact scenarios; corrected both federal 125% records and the annualizing formula; synchronized EPA model inputs and derived findings; added DNV's Massachusetts estimate, EPA's sampled-price layer, evidence-class visualizations and current transition/inspection details. |
Source: Commercial Refrigeration Leak Statistics Dataset public change log.
Footnotes
- [1]Editorial and Source Standards — KC Commercial Refrigeration. Source hierarchy, claim verification rules, AI-assistance policy and correction process.
- [2]GreenChill Annual Recognition Event 2024 — U.S. EPA GreenChill. 14.2% and 13.8% partnership rates, installed-charge endpoints, 25% historical estimate.
- [3]About the GreenChill Partnership — U.S. EPA GreenChill. GreenChill program origin, 2007 establishment, 25% historical estimate context.
- [4]Grocery Store Refrigerant Baseline Practices — DNV / Massachusetts EEAC. 15.6% regional assembled estimate, 16% recommended baseline, Massachusetts grocery chains operating ≥15 stores. October 30, 2025.
- [5]Regulatory Impact Analysis Addendum: Management of HFCs and Substitutes — U.S. EPA. September 2024. Table 3-3 modeled 2025 installed stock and annual leak emissions.
- [6]Direct Fugitive Emissions — Scope 1 and Scope 2 Inventory Guidance — U.S. EPA Center for Corporate Climate Leadership. 15%, 35% and 25% conservative screening factors and screening-method limitations.
- [7]2019 Refinement to the 2006 IPCC Guidelines, Volume 3, Chapter 7, Table 7.9 — IPCC. 1–15%, 10–35% and 7–25% default ranges by equipment class.
- [8]40 CFR §84.106 — Leak Repair — eCFR / U.S. EPA. Part 84 commercial-refrigeration 20% action threshold, inspection cadence and chronic-leak reporting. Applicability: January 1, 2026.
- [9]40 CFR §82.157 — Leak Repair — eCFR / U.S. EPA. Section 608 ODS commercial-refrigeration 20% action threshold and 125% chronic-leak reporting.
- [10]GreenChill Partnership Accomplishments — U.S. EPA GreenChill. 411 lb (2007) and 298 lb (2023) per partner store; $134 million in 2023; unresolved installed-charge statement.
- [11]GreenChill Certified Store Achievements — U.S. EPA GreenChill. More than $1,400 per store per year; more than 2.54 million metric tons CO2e avoided 2008–2024.
- [12]40 CFR §84.102 — Definitions — eCFR / U.S. EPA. Part 84 definitions including commercial refrigeration, full charge, annualizing method and rolling-average method.
- [13]40 CFR §84.108 — Automatic Leak Detection — eCFR / U.S. EPA. 1,500-lb threshold, installation timing, detection sensitivity, calibration requirements.
- [14]Kältemittel-Leckagerate liegt bei nur noch 1,0 % (2025 VDKF-LEC data) — VDKF. German 1.7% commercial category, 1.0% overall, ~307,000 systems in database, includes accidents.
- [15]Analysis of Economic and Environmental Impacts, Appendix D, Table D-1 — U.S. EPA. May 2026. Sampled public-buyer refrigerant prices through April 2026 for HFC-134a, R-404A, R-410A, R-448A, R-449A and HFO-1234yf.
- [16]Technology Transitions GWP Reference Table — U.S. EPA. 100-year GWP values used for all CO2e calculations. Last verified July 22, 2026.
How to cite this page
The following formats can be used to cite this reference in academic, policy or journalistic work. Substitute the access date and URL as appropriate for your citation style.
General / web citation
KC Commercial Refrigeration. (2026). "Refrigerant Leak Statistics 2026: Rates, Costs & EPA Rules." KC Commercial Refrigeration. Last verified July 22, 2026. Dataset version 1.1. https://kccommercialrefrigeration.com/research/refrigerant-leak-statistics/
APA 7th edition (approximate)
KC Commercial Refrigeration. (2026). Refrigerant leak statistics 2026: Rates, costs & EPA rules (Version 1.1). KC Commercial Refrigeration. https://kccommercialrefrigeration.com/research/refrigerant-leak-statistics/
Chicago 17th edition — notes (approximate)
KC Commercial Refrigeration, "Refrigerant Leak Statistics 2026: Rates, Costs & EPA Rules," version 1.1, last verified July 22, 2026, https://kccommercialrefrigeration.com/research/refrigerant-leak-statistics/.
MLA 9th edition (approximate)
KC Commercial Refrigeration. "Refrigerant Leak Statistics 2026: Rates, Costs & EPA Rules." KC Commercial Refrigeration, 22 July 2026, https://kccommercialrefrigeration.com/research/refrigerant-leak-statistics/.
Dataset download
The structured dataset is available as a CSV file: refrigerant-leak-statistics.csv (45 records, all normalization fields). Impact matrix: refrigerant-leak-impact-per-1000-lb.csv (6 scenarios, pounds and CO2e by refrigerant).
When citing data from these files, attribute to KC Commercial Refrigeration as shown above and note the dataset version (1.1) and verification date (July 22, 2026).